-
Latest Version
GraphPad Prism 10.6.1 LATEST
-
Review by
-
Operating System
Mac OS X 10.9 or later
-
User Rating
Click to vote -
Author / Product
-
Filename
InstallPrism10.dmg
GraphPad Prism for Mac is a professional statistics tool designed specifically to enable students, scientists, and researchers to streamline and optimize their research workflows by providing comprehensive data analysis and visualization tools.
With its ability to handle complex statistical analyses and create stunning graphs, this software is an essential tool for anyone involved in scientific research.
This software enables access to a structured environment for data entry and analysis, saving researchers time and ensuring that their analysis is based on clean and well-structured data.
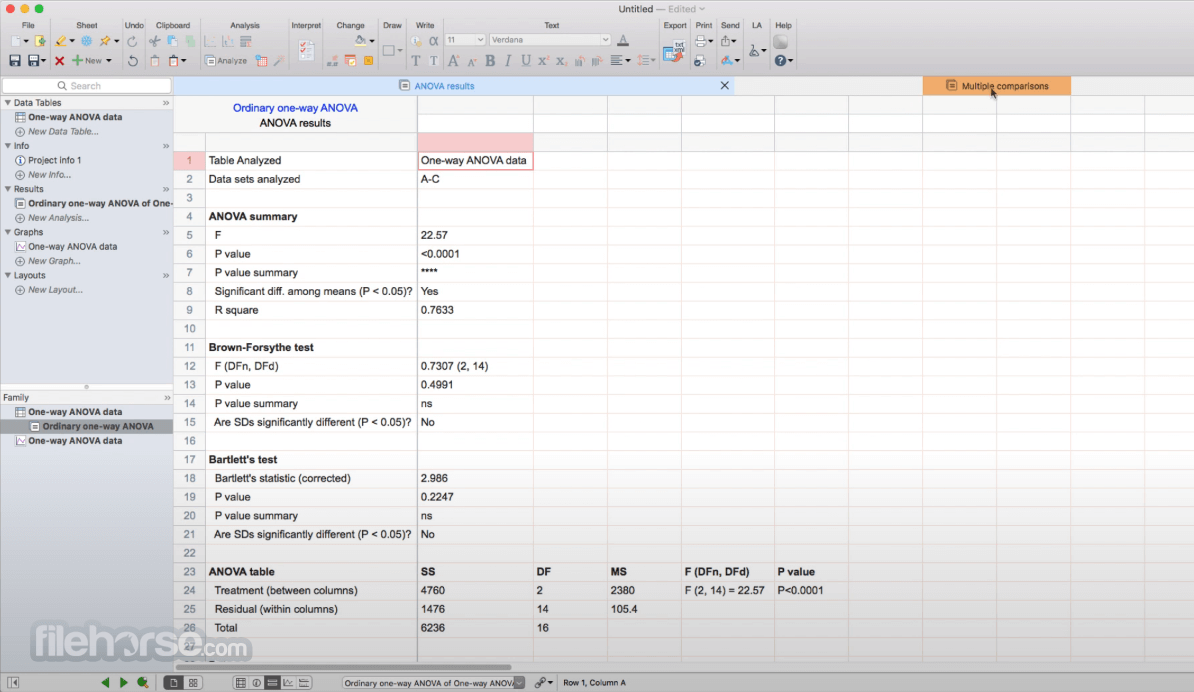
The app's ability to automatically update graphs and results in real-time also makes it an excellent choice for users who need to quickly visualize complex data sets and communicate their findings to team members, project leaders, and customers.
It is available in personal and group subscription packs, as well as a feature-static perpetual license for corporate and academic organizations.
Main Features
This professional app can be downloaded from the official website or secure FileHorse server, enabling fast and reliable deployment to any modern Mac via universal binary that is optimized for both Apple Silicon and Intel-based Mac computers.
Once fully installed, users can start using the app immediately without any need for additional configuration or setup.
How to Use
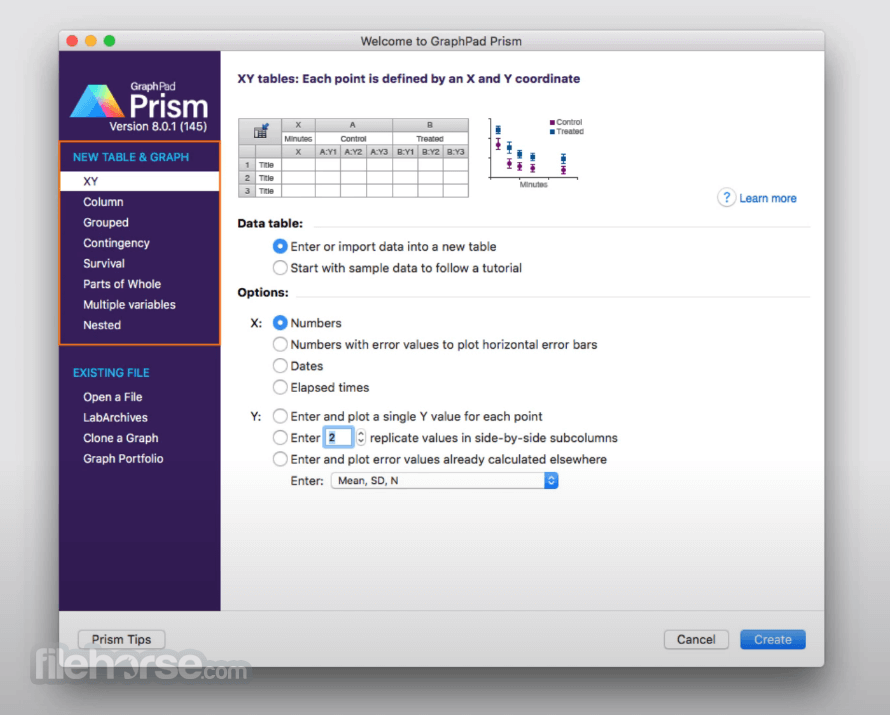
Upon starting the app for the first time, users can start by importing data sets, entering their data into the structured tables manually, and then selecting the desired analysis.
The app will then guide them through the analysis process, providing a checklist to help them understand the required statistical assumptions and confirm they have selected the correct analysis.
The main dashboard provides easy access to template analysis tools, available for activation on the left side of the app: XY, Column, Grouped, Contingency, Survival, Parts of Whole, Multiple variables, and Nested.
Newcomers are recommended to take advantage of the provided documentation and tutorials that can inform them about all the available tools and services this professional-grade analysis app offers.
User Interface
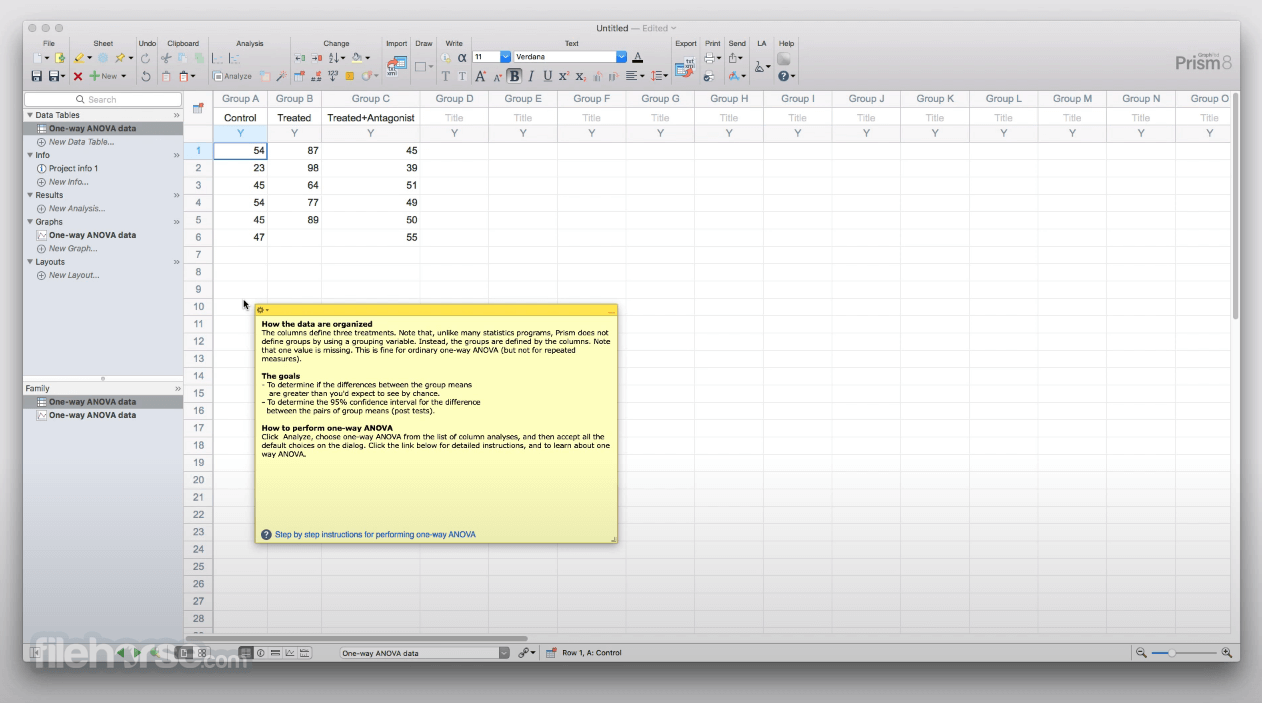
This app’s user interface is clean and intuitive, making it easy to navigate and use even for first-time users.
While the customization option of the main app is limited, it still provides enough flexibility for users to easily analyze even very large data sets.
FAQ
What is GraphPad Prism?
It is a powerful and versatile statistics tool designed specifically for students, scientists, and researchers.
Is it safe?
Yes. This is a safe and secure application that is free from malware and viruses. It receives regular functionality, stability, and security updates from a reputable software developer.
Alternatives
Excel – The world’s most popular spreadsheet software that includes a large offering of statistical analysis tools.
Python – A feature-rich programming language that includes a range of libraries and tools for data analysis and visualization.
R – A versatile programming language for statistical computing and data visualization.
Pricing
GraphPad Prism for Mac is an excellent choice for anyone involved in scientific research, providing access to comprehensive analysis capabilities used in academia and corporate environments.
It is an excellent choice for anyone looking to simplify their data analysis and visualization workflows.
Note: 30 days trial version.
Also Available: Download GraphPad Prism for Windows
With its ability to handle complex statistical analyses and create stunning graphs, this software is an essential tool for anyone involved in scientific research.
This software enables access to a structured environment for data entry and analysis, saving researchers time and ensuring that their analysis is based on clean and well-structured data.
The app's ability to automatically update graphs and results in real-time also makes it an excellent choice for users who need to quickly visualize complex data sets and communicate their findings to team members, project leaders, and customers.
It is available in personal and group subscription packs, as well as a feature-static perpetual license for corporate and academic organizations.
Main Features
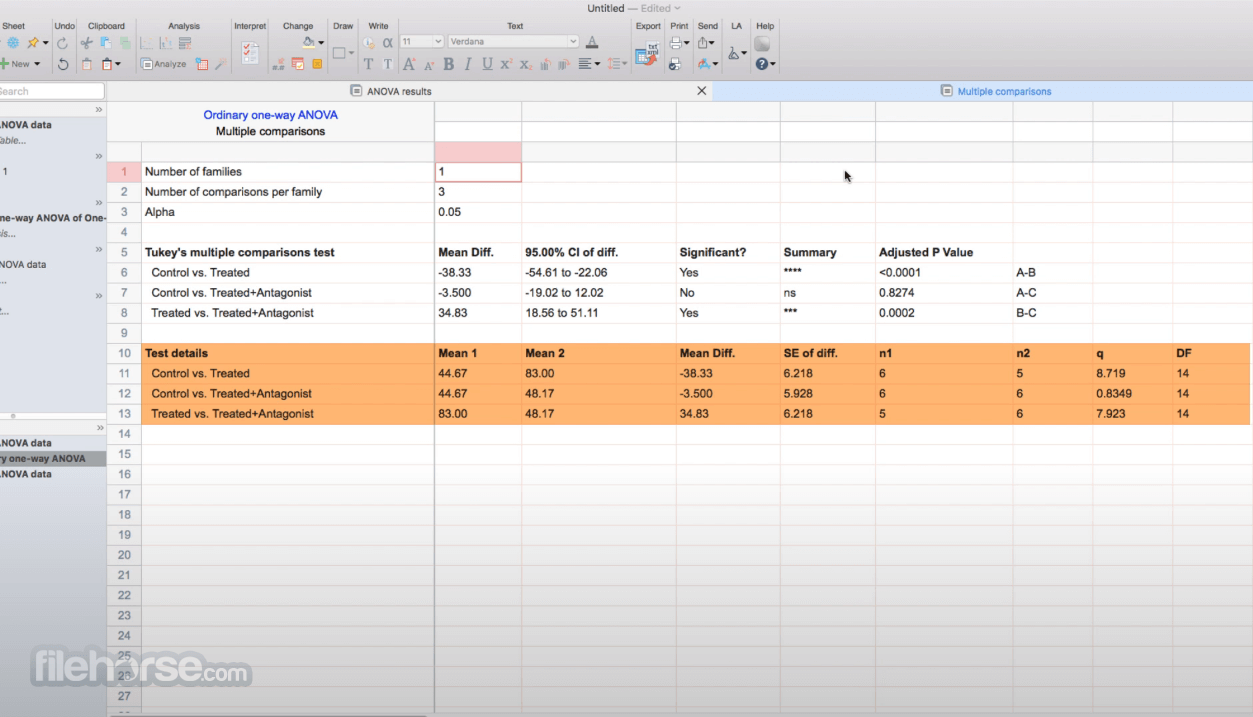
- Comprehensive Analysis – Access a wide range of statistical analyses, including nonlinear regression, nonparametric comparisons, one-, two- and three-way ANOVA, analysis of contingency tables, survival analysis, and many others.
- Data Wrangling – Enables professional data analysts to clean and structure their data in new ways.
- Customizable Data Table – Includes eight different types of data tables specifically formatted for analysis projects.
- Real-Time Updates – Get updated results in real-time, reflecting any changes to the data and analyses.
- No Coding Required – This software does not require any coding knowledge, making it accessible to users of all skill levels.
- Flexible Premium Pricing Options – Available for both individuals and organizations.
This professional app can be downloaded from the official website or secure FileHorse server, enabling fast and reliable deployment to any modern Mac via universal binary that is optimized for both Apple Silicon and Intel-based Mac computers.
Once fully installed, users can start using the app immediately without any need for additional configuration or setup.
How to Use
Upon starting the app for the first time, users can start by importing data sets, entering their data into the structured tables manually, and then selecting the desired analysis.
The app will then guide them through the analysis process, providing a checklist to help them understand the required statistical assumptions and confirm they have selected the correct analysis.
The main dashboard provides easy access to template analysis tools, available for activation on the left side of the app: XY, Column, Grouped, Contingency, Survival, Parts of Whole, Multiple variables, and Nested.
Newcomers are recommended to take advantage of the provided documentation and tutorials that can inform them about all the available tools and services this professional-grade analysis app offers.
User Interface
This app’s user interface is clean and intuitive, making it easy to navigate and use even for first-time users.
While the customization option of the main app is limited, it still provides enough flexibility for users to easily analyze even very large data sets.
FAQ
What is GraphPad Prism?
It is a powerful and versatile statistics tool designed specifically for students, scientists, and researchers.
Is it safe?
Yes. This is a safe and secure application that is free from malware and viruses. It receives regular functionality, stability, and security updates from a reputable software developer.
Alternatives
Excel – The world’s most popular spreadsheet software that includes a large offering of statistical analysis tools.
Python – A feature-rich programming language that includes a range of libraries and tools for data analysis and visualization.
R – A versatile programming language for statistical computing and data visualization.
Pricing
- Trial Plan: The app can be downloaded and tested for FREE during the generous trial period.
- Annual Student Plan: $142 per year, with free updates on two devices, access to Prism Academy, and a secure Cloud workspace.
- Annual Academic Plan: $230 per year, same features as in the Student plan.
- Annual Corporate Plan: $400 per year, same features as in the Student plan.
- Group Subscriptions: Premium yearly subscription plans for Academic and Corporate users.
- Perpetual Licenses: $1,600 for academic users and $3,200 for corporate users. Fixed feature set, no upgrades, online features, or group management tools.
- OS: macOS X 10.15 (Catalina)
- CPU: Any Intel or M-series Mac
- RAM: 2GB or more
- Display: Minimum 1024 x 768 resolution display
- Storage: 130 MB of free space
- Connectivity: Active internet connection for monthly license authentication.
- Comprehensive graph analysis.
- Dynamic analysis with real-time graph updates.
- No coding is required.
- Optimized for high-end research and corporate tasks.
- Steep learning curve.
- Expensive.
GraphPad Prism for Mac is an excellent choice for anyone involved in scientific research, providing access to comprehensive analysis capabilities used in academia and corporate environments.
It is an excellent choice for anyone looking to simplify their data analysis and visualization workflows.
Note: 30 days trial version.
Also Available: Download GraphPad Prism for Windows
Why is this app published on FileHorse? (More info)
-
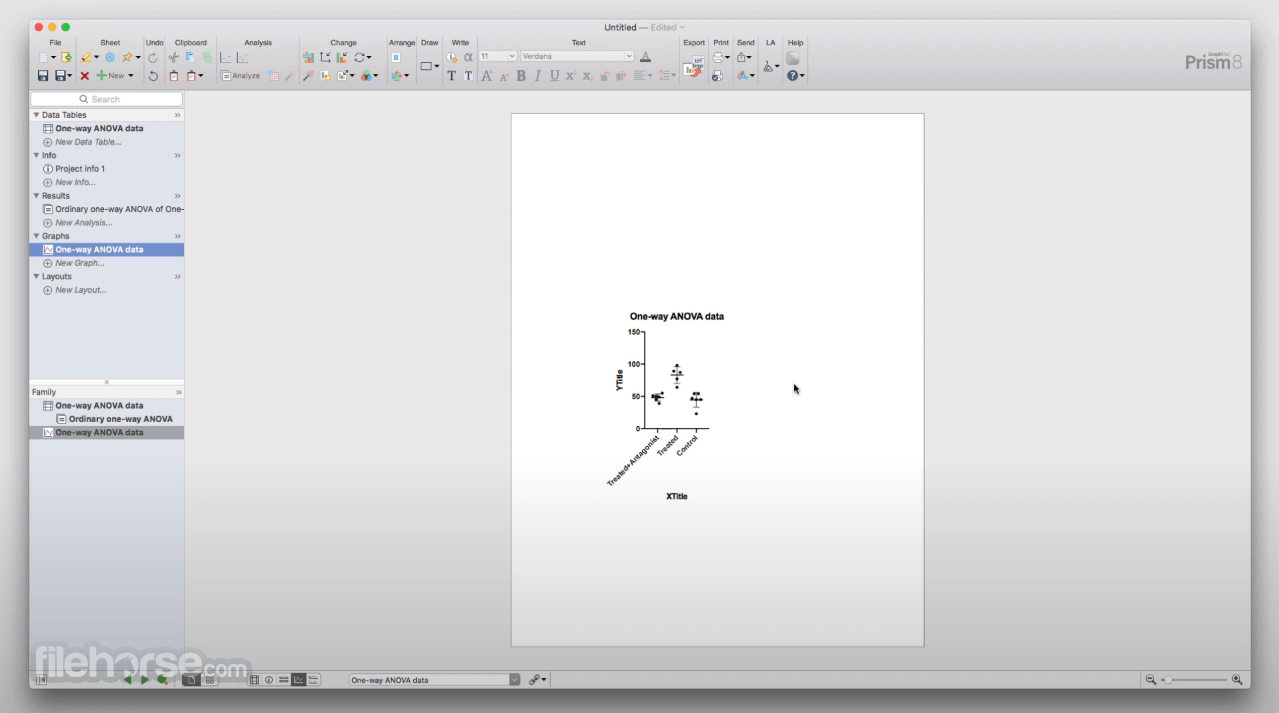
GraphPad Prism 10.6.1 Screenshots
The images below have been resized. Click on them to view the screenshots in full size.
-
-
-
-
 OperaOpera 134.0 Build 5954.26
 PhotoshopAdobe Photoshop CC 2026 27.8
 OKXOKX - Buy Bitcoin or Ethereum
 WPS OfficeWPS Office
 Adobe AcrobatAdobe Acrobat Pro 2026.001.21691
 CleamioCleamio 3.4.0
 MalwarebytesMalwarebytes 5.25.2
 TradingViewTradingView - Track All Markets
 CleanMyMacCleanMyMac X 5.2.10
 AdGuard VPNAdGuard VPN for Mac 2.9.0
Comments and User Reviews