




 Adobe Sign
 PDFelement
 Trade Ideas
 Swift
Swift Tungsten PDF
-
Latest Version
Gnuplot 6.0.5 LATEST
-
Review by
-
Operating System
Mac OS X 10.11 or later
-
User Rating
Click to vote -
Author / Product
-
Filename
gnuplot-6.0.5.tar.gz
-
MD5 Checksum
85176cf23a17c853d33a7da69aa44ed5
The source code is copyrighted but freely distributed (i.e., you don't have to pay for it). It was originally created to allow scientists and students to visualize mathematical functions and data interactively, but has grown to support many non-interactive uses such as web scripting.
It is also used as a plotting engine by third-party applications like Octave. It has been supported and under active development since 1986. Gnuplot supports many different types of 2D and 3D plots!
It supports many different types of output
Interactive screen display:
cross-platform (Qt, wxWidgets, x11) or system-specific (MS Windows, OS/2)
Direct output to file:
postscript (including eps), pdf, png, gif, jpeg, LaTeX, metafont, emf, svg...
Mouseable web display formats:
HTML5, svg
What does Gnuplot for macOS offer?
- Two-dimensional functions and data plots combining many different elements such as points, lines, error bars, filled shapes, labels, arrows, ...
- Polar axes, log-scaled axes, general nonlinear axis mapping, parametric coordinates
- Data representations such as heat maps, beeswarm plots, violin plots, histograms, ...
- Three-dimensional plots of data points, lines, and surfaces in many different styles (contour plot, mesh)
- Algebraic computation using integer, floating point, or complex arithmetic
- Data-driven model fitting using Marquardt-Levenberg minimization
- Support for a large number of operating systems, graphics file formats and output devices
- Extensive on-line help
- TEX-like text formatting for labels, titles, axes, data points
- Interactive command line editing and history
How to Use
Install using the package or terminal command brew install gnuplot
Open Terminal and type gnuplot to launch the interactive shell
Use plot or splot commands to visualize data sets
Load scripts using load 'filename.plt' for complex plotting
Export graphs using set terminal and set output commands
Use help command for built-in documentation and examples
System Requirements
- macOS 10.13 High Sierra or later
- Intel or Apple Silicon (via Rosetta or native build)
- X11 (XQuartz) for some terminal outputs
- Command Line Tools or Homebrew for installation
- 100 MB of free disk space
- Supports 2D and 3D plotting
- Highly customizable plotting styles
- Scriptable for automation and batch processing
- Wide range of output formats supported
- Cross-platform and open-source
- Lacks a graphical user interface
- Minimal real-time interactivity
- Limited built-in data manipulation
- Requires terminal or script usage
-
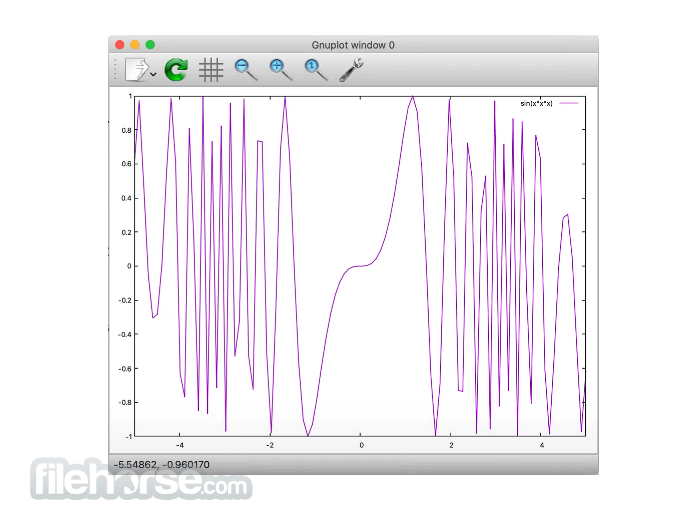
Gnuplot 6.0.5 Screenshots
The images below have been resized. Click on them to view the screenshots in full size.
What's new in this version:
New features:
Full mousing support for multiplots:
- all panels report mouse coordinates
- all panels respond to pan/zoom/rotate mouse movement and hotkeys
- "replot" reexecutes multiplot commands starting from current state
- "remultiplot" restores the original state before reexecuting multiplot
- interactive mousing remains active after ^C or "reset"
Unicode escape sequences \U+xxxx are accepted in more contexts:
- escape sequences are expanded in "noenhanced" strings
- escape sequences are expanded during substring evaluation
- escape sequences are expanded in string functions strstrt() and strlen()
New built-in function prod [<var> = <start> : <end>] <expression>:
- implements the sequential product operation
- prod [i=a:b] f(i) = f(a) * f(a+1) * ... * f(b)
Data files in EUC-JP encoding can be processed from other environments:
- If running in a EUC-JP locale, use "set encoding locale"
- If running in a different locale, use "set encoding eucjp"
- In either case, this affects only input data. It does not change the encoding (usually UTF-8) written to plots on output.
New coloring option for contourfill:
- Arbitrary discrete color ranges can be define without using a special palette
- set contourfill defined [zmin1:zmax1] color1, [zmin2:zmax2] color2, ...
- Allow "string"[i] as shorthand for "string"[i:i]
Changed behaviour:
- Trailing whitespace on the command line is now ignored on input. This means that the line-continuation character '\' is effective even if it is followed by an unintentional blank.
- Octal escape sequences must conform to the documented form \ooo
- E.g. \7 or \0106 or \456 or \0 are now rejected
- "plot with labels" now accepts the "noenhanced" keyword
Fixed:
- qt: Slow font initialization on Windows Bug 2316 2476
- gd: Resolved long-standing font handling problems. Bug 2819
- requires recent library versions (libgd 2.4.0 libraqm 0.10.3)
webp:
- possible corruption of single-frame multiplots Bug 2876
- incorrect alpha compositing onto transparent background Bug 2878
- Better tic placement on logscale axis spanning two decades Bug 2856
- Always clear previous plot title before a new plot is started Bug 2865
- Endpoint errors due to floating point precision Bug 2768
- Repaired axis range parsing in parametric mode broken by change in 6.0.4
- Reworked logic for extending the command buffer incrementally on input. Long input lines with backslash continuation could lead to corruption of the command string if encountered early in program execution.
- Preserve blank lines in output from "plot with table"
 OperaOpera 134.0 Build 5954.56
 PhotoshopAdobe Photoshop CC 2026 27.9.1
 OKXOKX - Buy Bitcoin or Ethereum
 WPS OfficeWPS Office
 Adobe AcrobatAdobe Acrobat Pro 2026.001.21789
 CleamioCleamio 3.4.0
 MalwarebytesMalwarebytes 5.25.2
 TradingViewTradingView - Track All Markets
 CleanMyMacCleanMyMac X 5.2.10
 AdGuard VPNAdGuard VPN for Mac 2.9.0
Comments and User Reviews